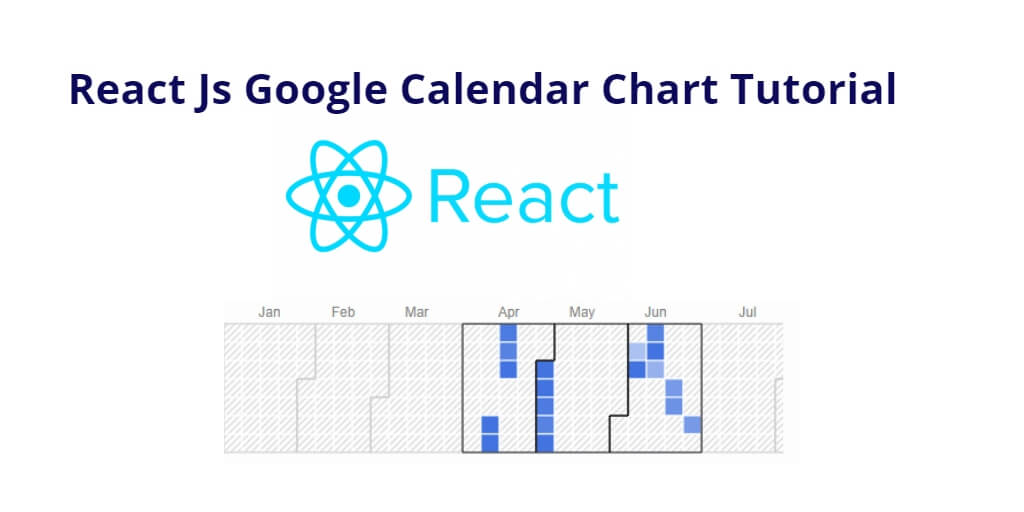
Google Calendar Charts is a visualization tool that displays calendar events as blocks in a year-long calendar. It can be a useful tool for businesses, schools, or any organization that needs to visualize events over a longer time period. In this tutorial, you will learn how to implement Google Calendar Charts in React JS.
How to Implement Google Calendar Charts in React Js
Follow the following steps and create google calendar charts in react js app:
- Step 1 – Create React App
- Step 2 – Install Bootstrap & react-google-charts Package
- Step 3 – Create Google Calendar Chart Component
- Step 4 – Add Component in App.js
Step 1 – Create React App
In this step, open your terminal and execute the following command on your terminal to create a new react app:
npx create-react-app my-react-app
To run the React app, execute the following command on your terminal:
npm start
Check out your React app on this URL: localhost:3000
Step 2 – Install Bootstrap & react-google-charts Package
In the terminal, navigate to the project directory and install the necessary dependencies. You will use bootstrap and the react-google-charts package to implement the Google Calendar Chart. Type the following command:
npm install bootstrap

# npm
npm install react-google-charts

# yarn
yarn add react-google-charts
Step 3 – Create Google Calendar Charts Component
Visit the src directory of your react js app and create a google calendar chart component named GoogleCalendarChart.js. And add the following code into it:
import React, { Component } from "react";
import Chart from "react-google-charts";

const data = [
  [{ type: 'date', id: 'Date' }, { type: 'number', id: 'Won/Loss' }],
  [new Date(2012, 3, 13), 37032],
  [new Date(2012, 3, 14), 38024],
  [new Date(2012, 3, 15), 38024],
  [new Date(2012, 3, 16), 38108],
  [new Date(2012, 3, 17), 38229],
  [new Date(2013, 1, 4), 38177],
  [new Date(2013, 1, 5), 38705],
  [new Date(2013, 1, 12), 38210],
  [new Date(2013, 1, 13), 38029],
  [new Date(2013, 1, 19), 38823],
  [new Date(2013, 1, 23), 38345],
  [new Date(2013, 1, 24), 38436],
  [new Date(2013, 2, 10), 38447],
];

class GoogleCalendarChart extends Component {

  constructor(props) {
    super(props)
  }

  render() {
      return (
          <div className="container mt-5">
              <h2>React Js Calendar Chart Example</h2>

              <Chart
                  width={1000}
                  height={400}
                  chartType="Calendar"
                  loader={<div>Loading Chart</div>}
                  data={data}
                  options={{
                    title: 'Red Sox Attendance',
                  }}
                  rootProps={{ 'data-testid': '1' }}
              />
          </div>
      )
  }
}

export default GoogleCalendarChart;
This code imports two components from external libraries – React and Chart from react-google-charts. It then defines an array of data representing dates and corresponding values.
The class GoogleCalendarChart is defined as a child class of the Component class of the React library. It has a constructor method that takes in props and calls the super method. However, since there is no additional functionality added in the constructor, it is not strictly necessary.
The render method returns a div element with a title and a Chart component. The Chart component is passed several props, including width, height, chartType, data, options, and rootProps. These props specify the size, type, and data to be displayed in the chart, as well as styling options.
Finally, the GoogleCalendarChart component is exported as the default export of this module, so that it can be imported into other parts of the application.
Step 4 – Add Component in App.js
In this step, you need to add GoogleCalendarChart.js file in src/App.js file:
import React from 'react';

import '../node_modules/bootstrap/dist/css/bootstrap.min.css';
import GoogleChart from './components/GoogleCalendarChart';


function App() {
  return (
    <div className="App">
      <GoogleCalendarChart />
    </div>
  );
}

export default App;
Conclusion
Throughout this tutorial, you have learned how to create react calendar chart component in react js application using google charts library.
