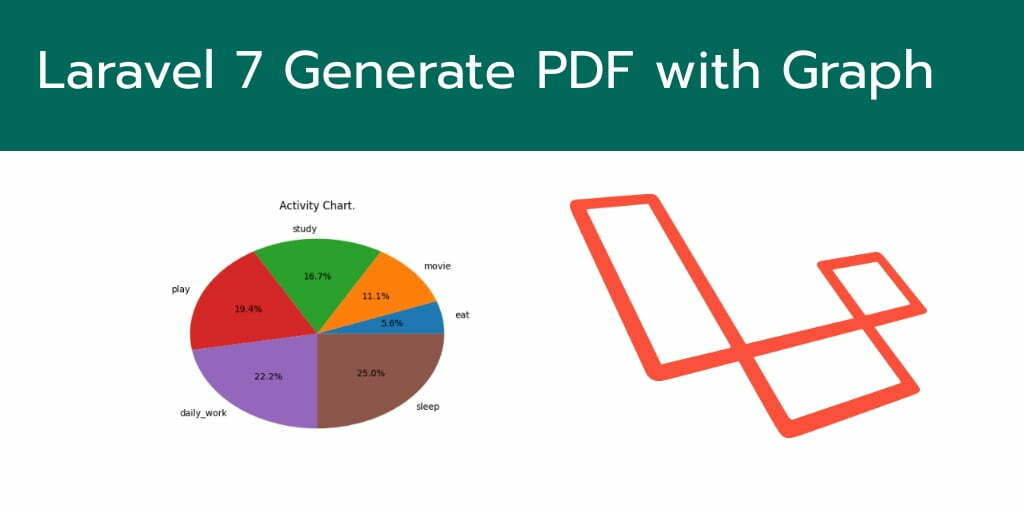
In this generate pdf with graph in laravel example, you will learn how to generate pdf with graph using package in laravel.
Sometimes, you work with large laravel applications at that time, you may need display statics of apps in the graph and download it in pdf format.
This tutorial will guide you to step by step from scrath to generate pdf with graph in laravel application.
Note that, this example works with different laravel version laravel 7, 6, 5.
Generate PDF with Graph in Laravel
Follow the following steps and generate pdf with graph in laravel:
- Step 1: Install wkhtmltopdf Software
- Step 2: Download Laravel Fresh App
- Step 3: Install mikehaertl/phpwkhtmltopdf
- Step 4: Add Routes
- Step 5: Create Controller by Command
- Step 6: Create Blade View
- Step 7: Run Development Server
Step 1: Install wkhtmltopdf Software
First of all, you need to install wkhtmltopdf software on your web server. The following commands will install this software into your webservers:
For Ubuntu:
sudo apt install wkhtmltopdf
For Windows:
You have go the following link and download exe. Then install it:
https://wkhtmltopdf.org/
Step 2: Download Laravel Fresh App
In this step, you need to install laravel latest application setup, So open your terminal OR command prompt and run the following command:
composer create-project --prefer-dist laravel/laravel blog
Step 3: Install mikehaertl/phpwkhtmltopdf
In this step, you need to install mikehaertl/phpwkhtmltopdf package. So again open your command prompt and run the following command:
composer require mikehaertl/phpwkhtmltopdf
Step 4: Add Routes
Next step, open your web.php file and add the following routes into your file:
routes/web.php
Route::get('graph', 'GraphPdfController@index');
Route::get('download', 'GraphPdfController@download')->name('download');
The first route will show graph on web page and the second one is download the pdf file.
Step 5: Create Controller by Command
Next open your command prompt and run the following command to create a controller by artisan:
php artisan make:controller GraphPdfController
This command will create a controller that name GraphPdfController.php.
Next go to app/Http/Controllers and open GraphPdfController.php. Then update the following methods into your controller file:
<?php

namespace App\Http\Controllers;

use Illuminate\Http\Request;
use mikehaertl\wkhtmlto\Pdf;

class GraphPdfController extends Controller
{
    /**
     * Write code on Construct
     *
     * @return \Illuminate\Http\Response
     */
    public function index()
    {
        return view('graph');
    }

    /**
     * Write code on Construct
     *
     * @return \Illuminate\Http\Response
     */
    public function download()
    {
        $render = view('chart')->render();

        $pdf = new Pdf;
        $pdf->addPage($render);
        $pdf->setOptions(['javascript-delay' => 5000]);
        $pdf->saveAs(public_path('report.pdf'));

        return response()->download(public_path('report.pdf'));
    }
}
In this controller, you have update two methods. First index() method will load the web page and display the graph with data. And the downlaod() method will download the pdf file.
Step 6: Create View File
Go to resources/views/ folder and create a new blade view file that name graph.blade.php file.
After that, update the following code into your graph.blade.php file:
<!DOCTYPE html>
<html>
<head>
    <meta charset="utf-8">
    <script src="https://www.google.com/jsapi"></script>
    <style>
        .pie-chart {
            width: 600px;
            height: 400px;
            margin: 0 auto;
        }
        .text-center{
            text-align: center;
        }
    </style>
</head>
<body>

<h2 class="text-center">Generate PDF with Chart in Laravel</h2>

<div id="chartDiv" class="pie-chart"></div>

<div class="text-center">
    <a href="{{ route('download') }}">Download PDF File</a>
    <h2>tutsmake.com.com</h2>
</div>

<script type="text/javascript">
    window.onload = function() {
        google.load("visualization", "1.1", {
            packages: ["corechart"],
            callback: 'drawChart'
        });
    };

    function drawChart() {
        var data = new google.visualization.DataTable();
        data.addColumn('string', 'Pizza');
        data.addColumn('number', 'Populartiy');
        data.addRows([
            ['Laravel', 33],
            ['Codeigniter', 26],
            ['Symfony', 22],
            ['CakePHP', 10],
            ['Slim', 9]
        ]);

        var options = {
            title: 'Popularity of Types of Framework',
            sliceVisibilityThreshold: .2
        };

        var chart = new google.visualization.PieChart(document.getElementById('chartDiv'));
        chart.draw(data, options);
    }
</script>

</body>
</html>
Step 7: Run Development Server
In this step, use the following php artisan serve command to start your server locally:
php artisan serve
Now we are ready to run our example so run bellow command to quick run.
http://127.0.0.1:8000/graph
Conclusion
In this generate pdf with graph in laravel example, you have learned how to generate pdf file with graph and display data in web page.
